Land restoration to fight climate change & biodiversity conservation
Soil regeneration project in Soto – Santa Isabel, Ángel Trías, Chih., Mexico a degradated land restored
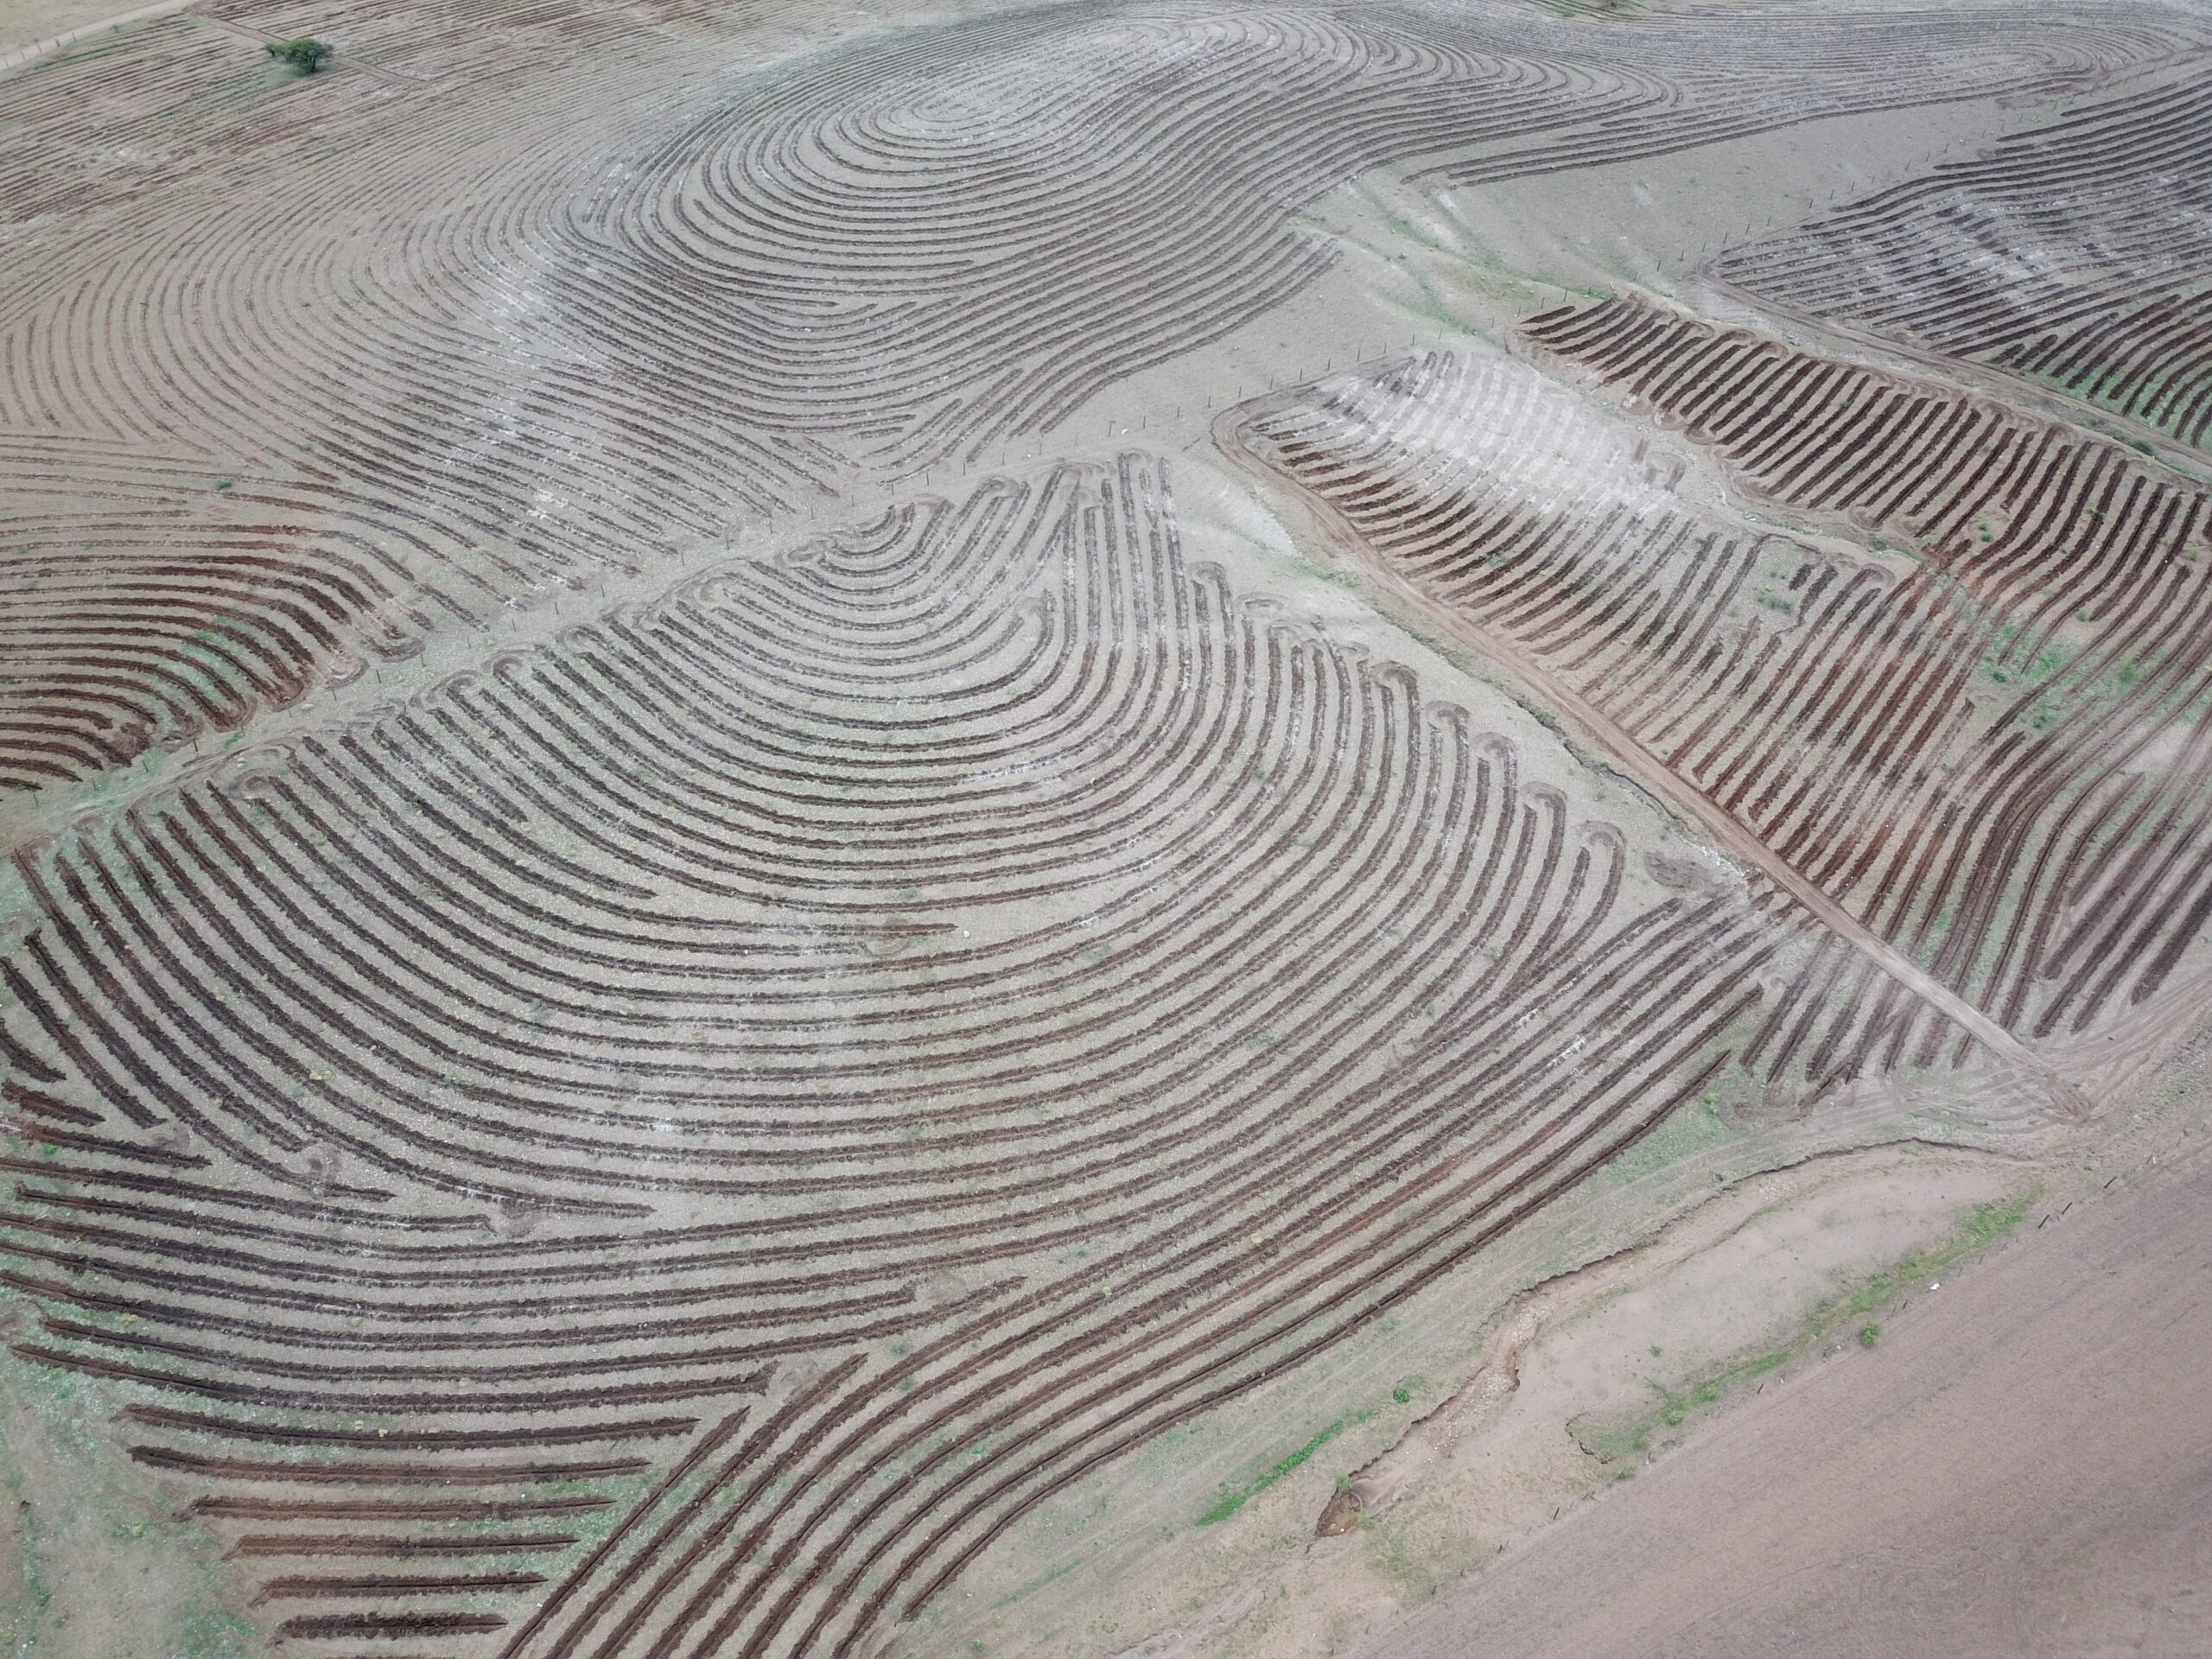
The site where the project was developed is an area with high disturbance due to cattle farming activities. This land management combined with wind and water erosion have completely stripped the land of its vegetation, thus eliminating the environmental services it provides.
About the project
Santa Isabel Water Forest is a project developed by the promoters Life Terra and 2°much!, which is located in the community of Santa Isabel, Municipio of Ángel Trías, in the state of Chihuahua, Mexico. The project proponent has an agreement with the landowner for the use of the land for a term of 30 years, so that during this period no actions may be taken that disturb or damage the groundwork and the upcoming plantation.
The site where the project was developed is an area with high disturbance due to cattle farming, so the soil restoration activities represent the first step in the overall restoration process. The area had areas devoid of vegetation and problems due to erosion leading to soil loss and lack of water infiltration.
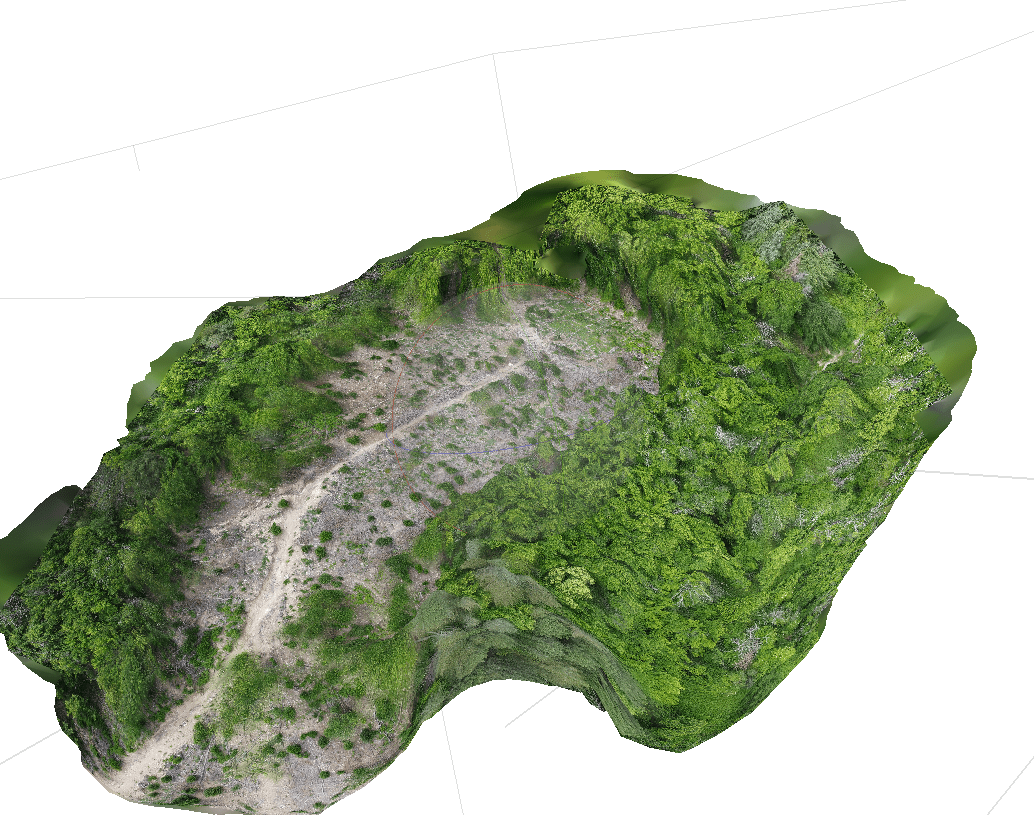
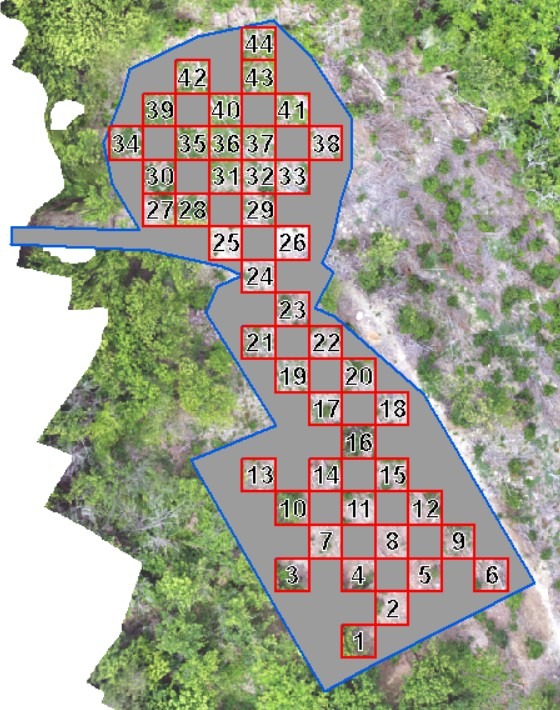
In the 7.91 Ha of the project’s area, soil works called “zanja bordo” were built along contour lines. The purpose of these works is to capture and retain rainwater for the soil to increase and regulate its moisture level, which in turn contributes to the reduction of soil loss and benefits water infiltration. In addition, these works are meant to retain seeds that are blown away by wind erosion helping vegetation to establish itself, stabilizing the soil, and absorbing rainwater more quickly.
Erosion prevention and credit issuance (VSCs)
The project area has been assessed according to the aOCP Methodology fo soil and erosion assessment V2.0. . The construction of the soil works will prevent the loss of 1,149 tons of soil over the 30-year life of the facility. Between 2021 and 2022, the soil loss in the parcel decreased from 89.61 tons to 33.95 tons, representing a decrease of 62.11% over just one year. Simultaneously, the entire basin also experienced a decline in soil loss, from 5762.67 tons to 5431.65 tons in the same year, equivalent to a 5.74% decrease. In 2023, a further decrease by 2.01 tons of soil loss from the project area signifying a 5.92% reduction is observed.
Such significant reductions in soil loss are of paramount importance for the overall health and sustainability of the basin’s ecosystem. By mitigating erosion rates, the restoration project contributes to the protection of valuable soil resources, supports sustainable land use practices, and helps maintain water quality in the region. These results underscore the effectiveness of the implemented conservation practices and provide valuable evidence for guiding future land management decisions and restoration initiatives in similar regions.
Water infiltration and credit issuance
The project area has been assessed according to the aOCP Methodology for the assessment of groundwater recharge restoration.
The methodology establishes 3 approaches for the assessment of infiltration, which is then used as input for the Thornthwaite-Mather water balance model: 1.-Soil conservation service curve number (SCS-CN), 2.- Literature data, 3.- Machine Learning model based on fiel and satellite data.
Ground water storage was assessed for 3 scenarios:
1.-Before deforestation. As deforestation in the Project area occurred in November 2021, spring and summer of that year are representative of the original forest.
2.-After deforestation. Spring and summer 2022 are representative of the Area without tree cover, experiencing high rates of runoff and low infiltration.
3.-After project implementation. Spring and summer 2023 are representative of the Project area once soil works and reforestation took place.
The potential for generation of water credits was calculated based on the expected groundwater recharge. Assuming that the project leads to the restoration of the Project area in 40 years, it will improve from the current -452 mm up to -429 mm per year. This calculation is based on a linear progression. Each mm in GWS equals 1 L/m2 . Given that the surface of the restored area is 5,600 m2, each mm increase represents an increase in groundwater recharge of 5.6 m3. considering the Project surface, the potential of the project to generate Water Credits, at year 40 the Project will have generated a total of 2640 Water credits.
Soil Credits
The project area has been assessed according to the aOCP Methodology for soil health assessment. The assessment has 2 components: soil health assessment and erosion assessment.
There are 2 relevant events that determine the assessment of the Project area: deforestation, which occurred in November 2021, and Project implementation, which took place in the first quarter of 2023.
Soil erosion was assessed for 4 scenarios:
Before deforestation. As deforestation in the Project area occurred in November 2021, spring and summer of that year are representative of the original forest.
After deforestation. Spring and summer 2022 are representative of the Area without tree cover, experiencing high rates of erosion.
After project implementation. Spring and summer 2023 are representative of the Project area once soil works and reforestation took place.
Restored scenario. Is the expected outcome of the project once the planted trees reach maturity and the forest recovers its original characteristics, as it was before deforestation.
Erosion was assessed using the RUSLE equation, which includes 5 components.
1. Rainfall erosivity (R-factor). Was obtained from the RUSLE2015 dataset, provided by the EUROPEAN SOIL DATA CENTRE (ESDAC) Joint Research Center, available at: https://esdac.jrc.ec.europa.eu/themes/rainfall-erosivity-europe
2. Soil erodibility (K-factor). Was obtained from the RUSLE2015 dataset, provided by the EUROPEAN SOIL DATA CENTRE (ESDAC) Joint Research Center, available at: https://esdac.jrc.ec.europa.eu/themes/soil-erodibility-europe
3. Slope length and slope steepness (LS- factor). The LS factor was calculated with the equation from Moore & Wilson (1992) [eq. 1] on a 5m spatial resolution DEM, the RGE ALTI® 5M dataset, downloaded from https://geoservices.ign.fr/rgealti.
Where As = unit contributing area (m), θ = slope in radians, m = 0.4 and n = 1.3.
4. Cover Management (C-factor). Was calculated with the equation developed by van der Knijff et al. (1999) [eq. 2] on the NDVI computed from Sentinel-2 images.
For the calculation of amount of soil that was prevented from eroding, we use the percent change. From 2022 to 2023, the erosion rate increased 77.2% in the microbasin and 21.4% inside the parcel.
The estimated total soil loss inside the parcel is 79.105 tons in 2022 and 96.065 tons in 2023. If the Project activities were not implemented and the parcel experienced the same increase as all the microbasin, the soil loss inside the parcel would be 140.289 tons. This means that 44.22 tons of soil inside the parcel will not be lost in 2023 thanks to the implementation of soils works and reforestation.
As planted trees continue to grow, vegetation cover will increase and contribute to decrease the erosion rate. It is expected that erosion rate will descend to the value it had before deforestation and even less, considering the soil works. Therefore, when trees reach maturity the Project’s contribution will be a reduction of the erosion rate of -31.58 t ha-1 y-1, which for the Parcel area means 79.09 tons of soil per year that will not be lost thanks to soil works.
Santa Isabel Water forest
Land restoration
Project Developer:


Certification:
ases On-Chain Protocol (aOCP)
Location:
Santa Isabel, Chihuahua, Mexico
To estimate the maximum number of credits to which the project could aspire, a simulation was carried out considering that the variables analyzed would have a greater positive response to the different factors evaluated throughout the life of the project. That is if during the monitoring determined in the Monitoring Plan, results are obtained that demonstrate that the biodiversity index measured with Shannon significantly increased for the preserved area and key species, in addition to demonstrating that fragmentation decreased and therefore the fractal dimension, and that the project improved the spatial continuity of the landscape.
Once the above-mentioned variables have been ranked with the factor relativized to the maximum probable, it is determined that the Lentillères project could reach a maximum of 697 credits.
Nat5 Score
Key project: VMF-LT01-112022D
Developer: LifeTerra
Person responsible: Sven Kallen
Land owner: Marco Schoop
The project used the densified reforestation technique, which consists of planting a greater number of trees per unit area, and establishing seedlings closer together, compared to traditional reforestation techniques.
This technique benefits the acceleration of the forest recovery process by having more trees growing in the area, increasing competition for light, nutrients, and water, which stimulates faster tree growth. In addition, it benefits biodiversity by creating a denser environment, providing more habitats and resources for various plant and animal species, and promoting biodiversity.
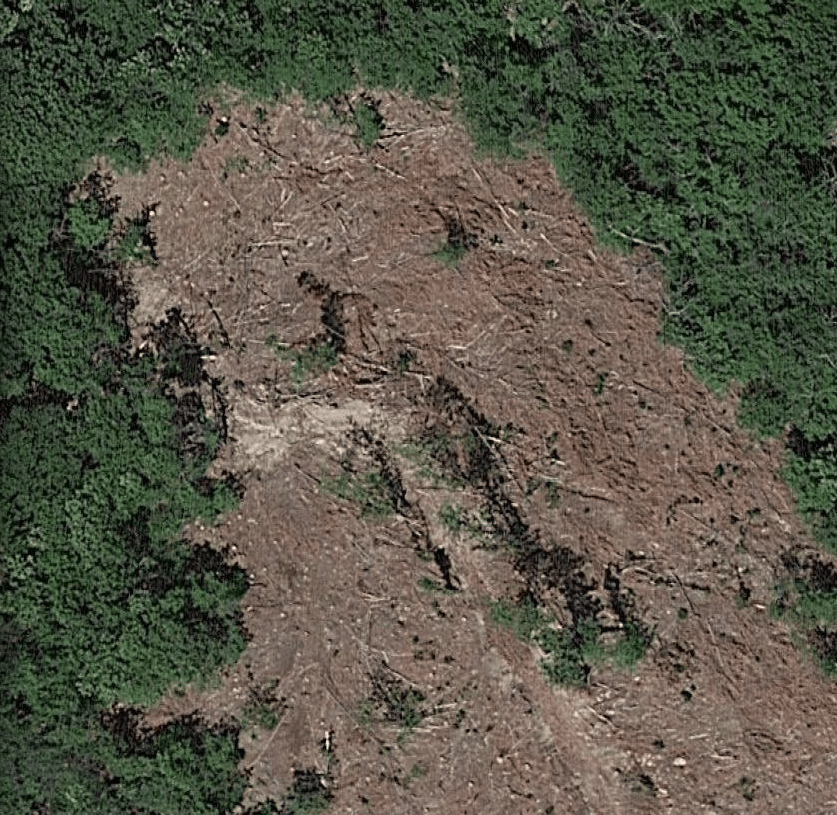
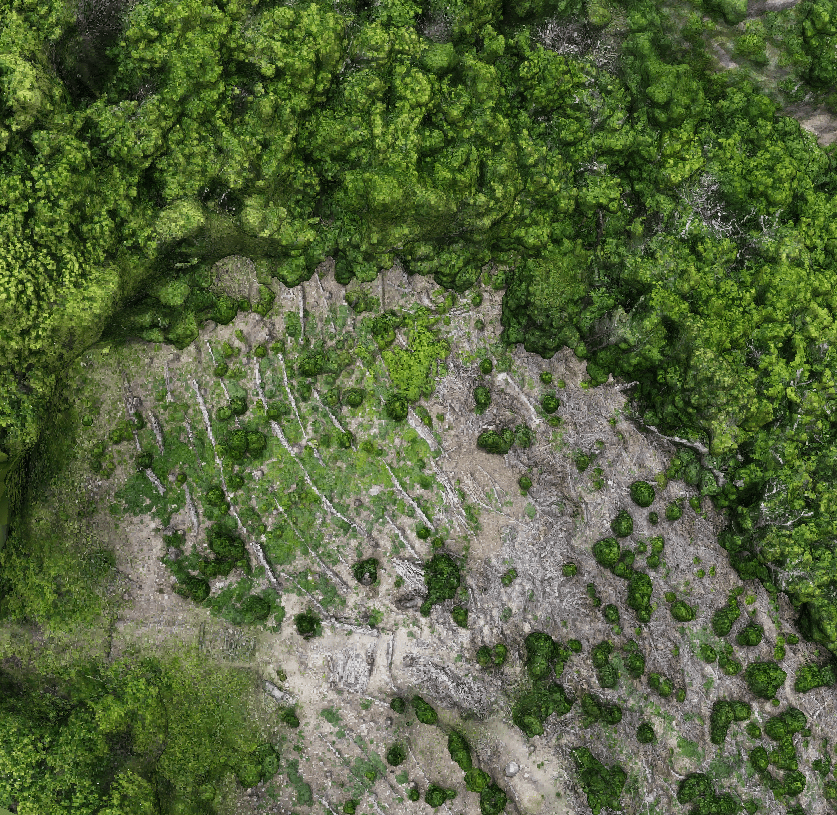
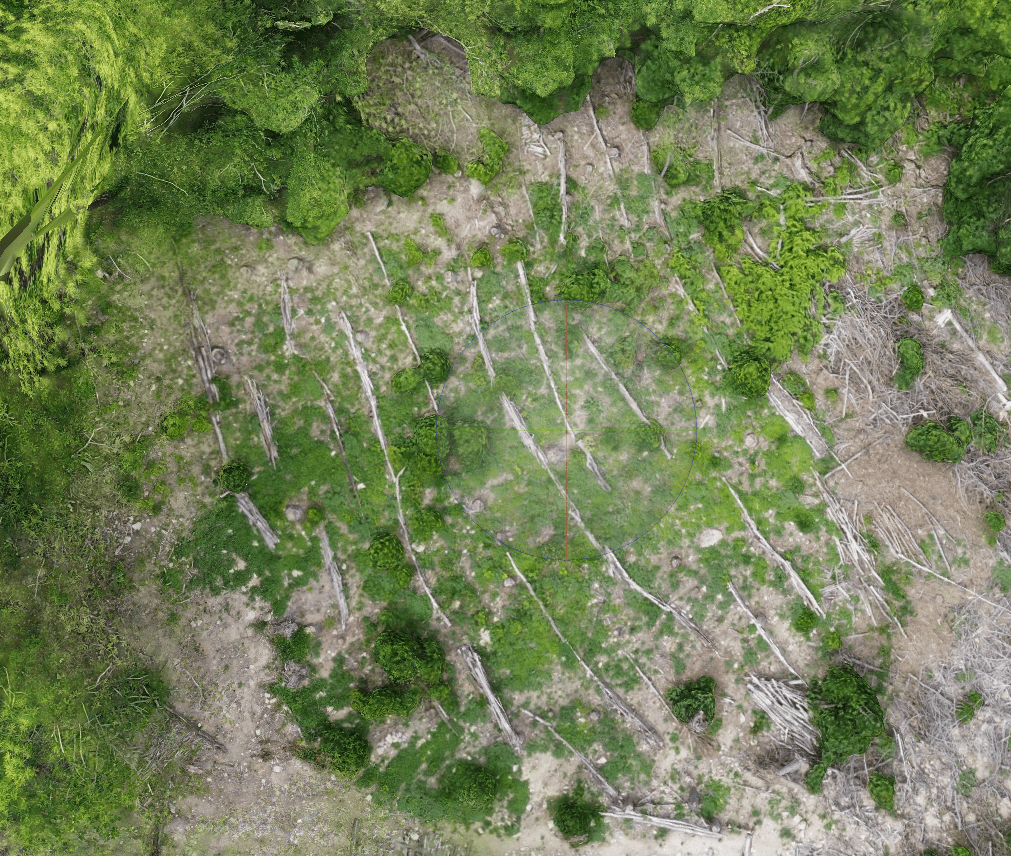
Verification will be done using satellite data and AI algorithms provided by KANOP© and CDS ToolBox©

Validation assessed by OXALIS

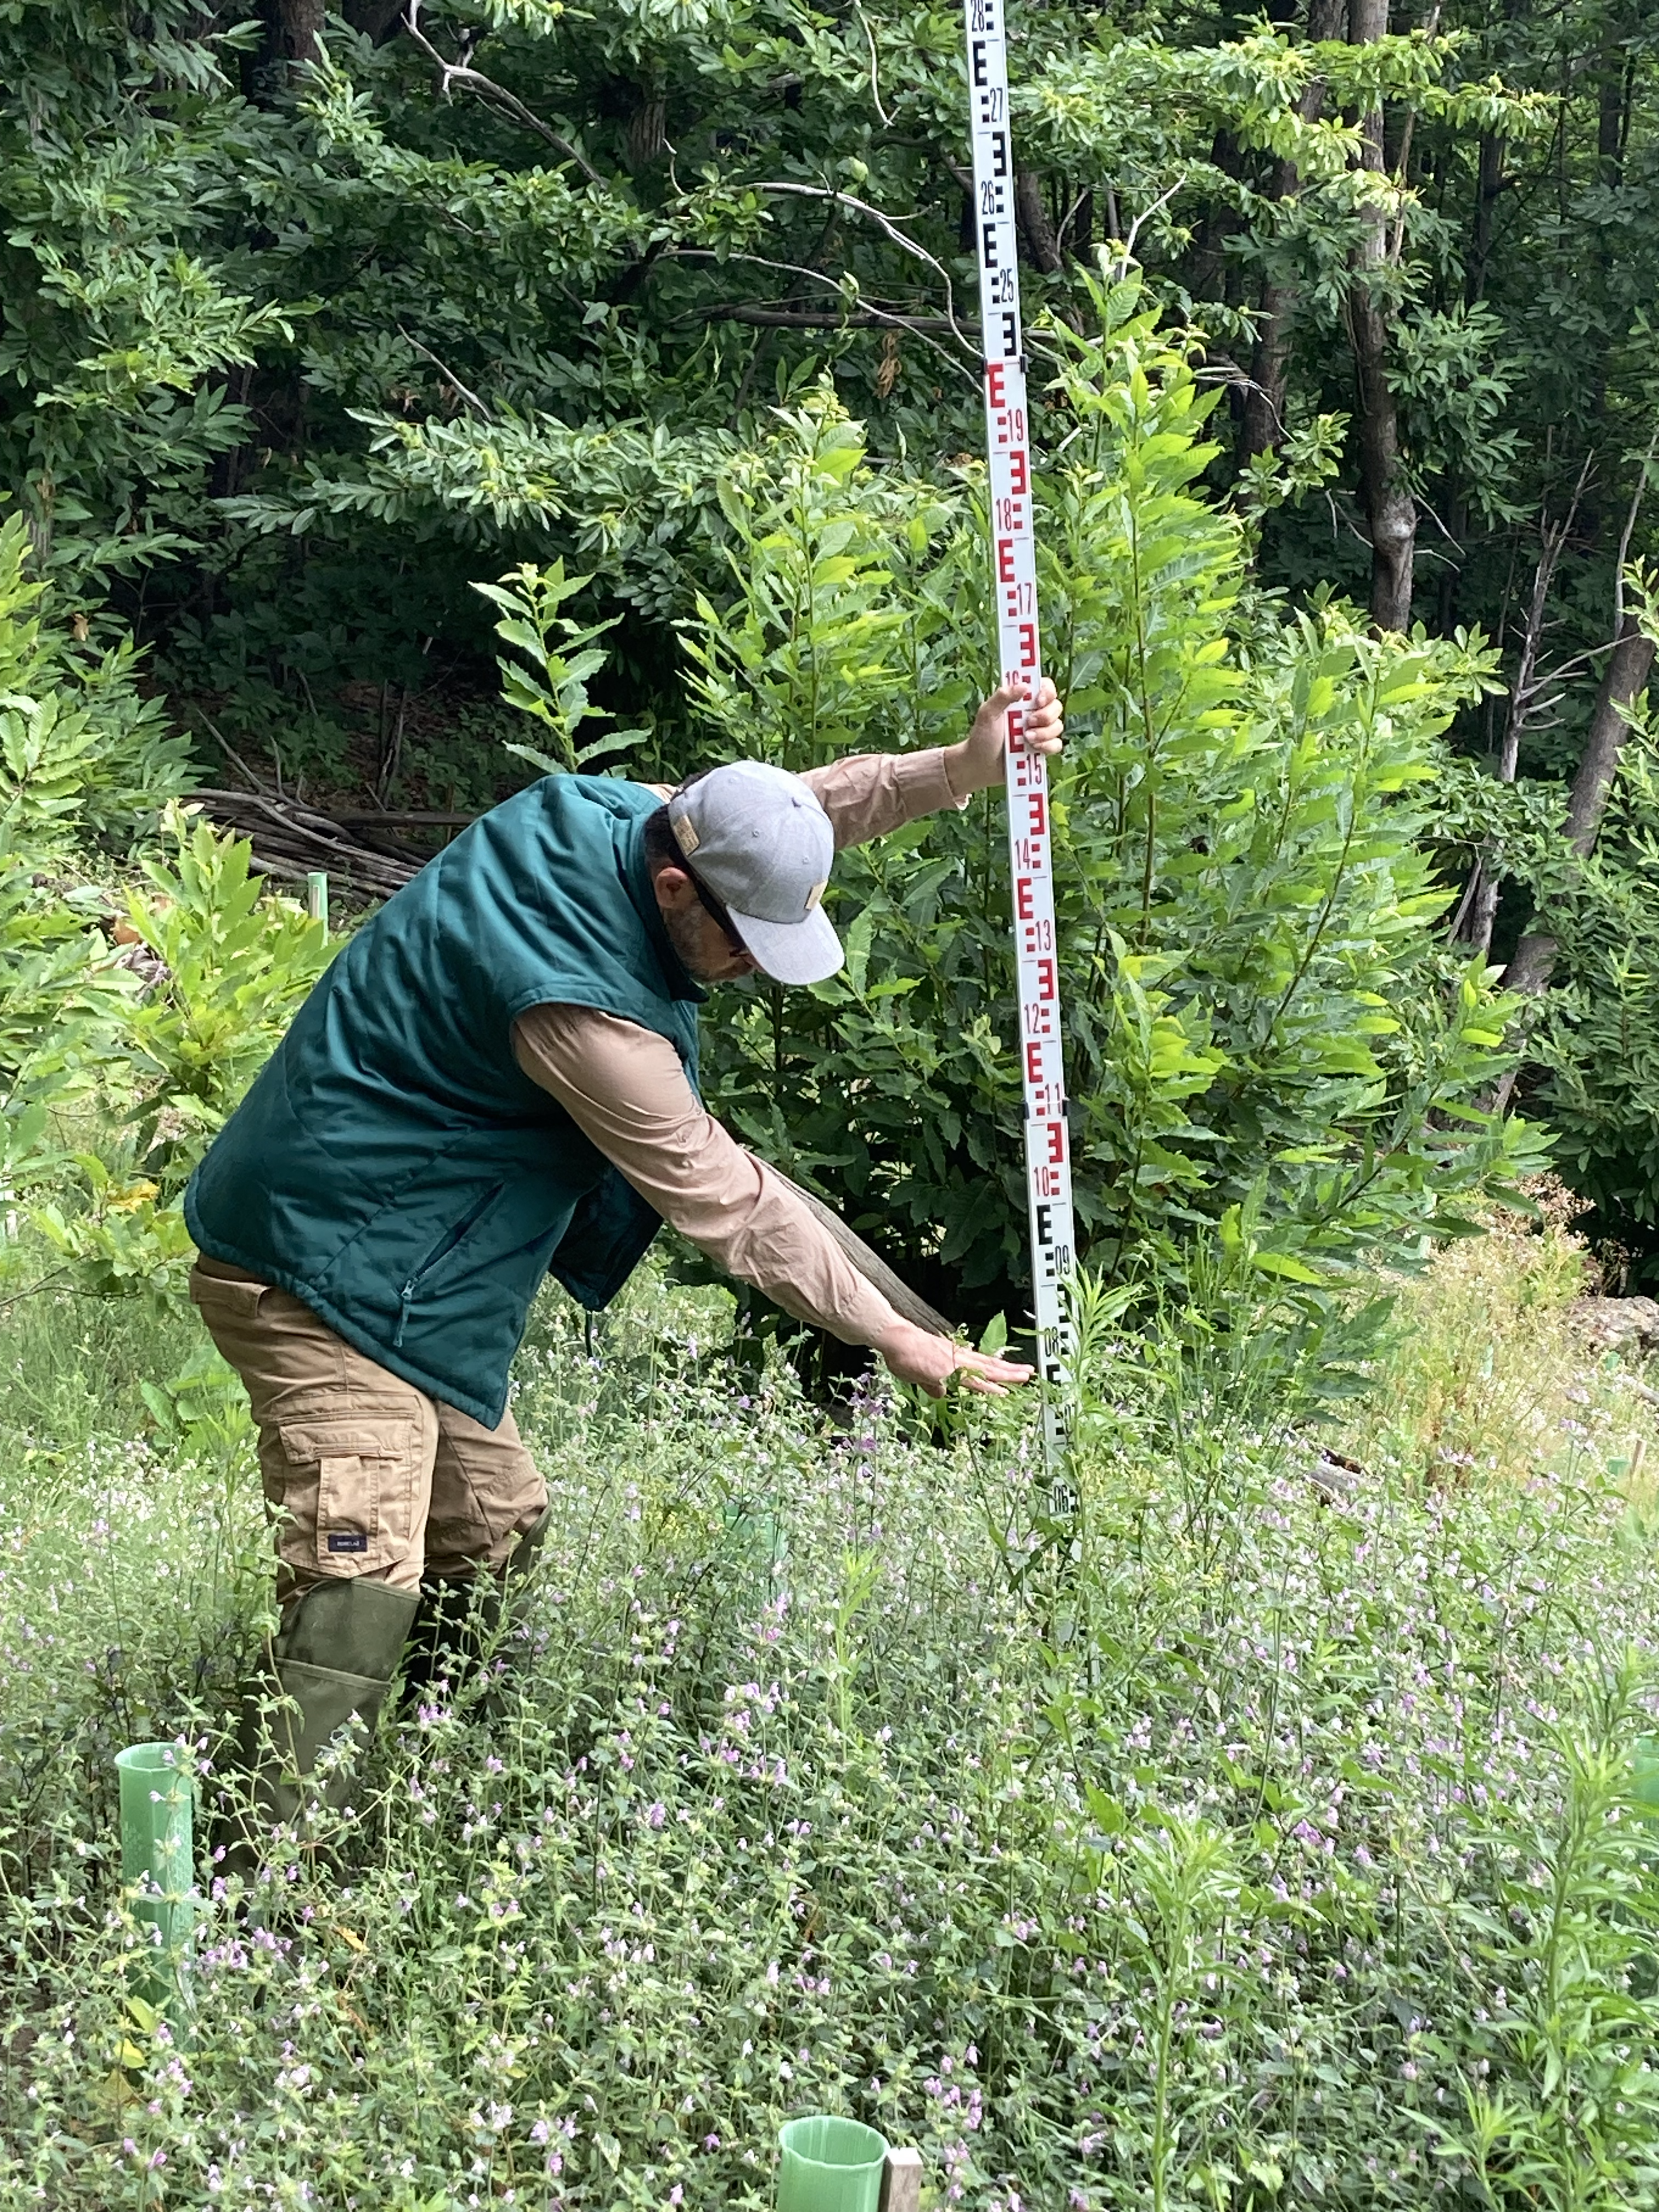

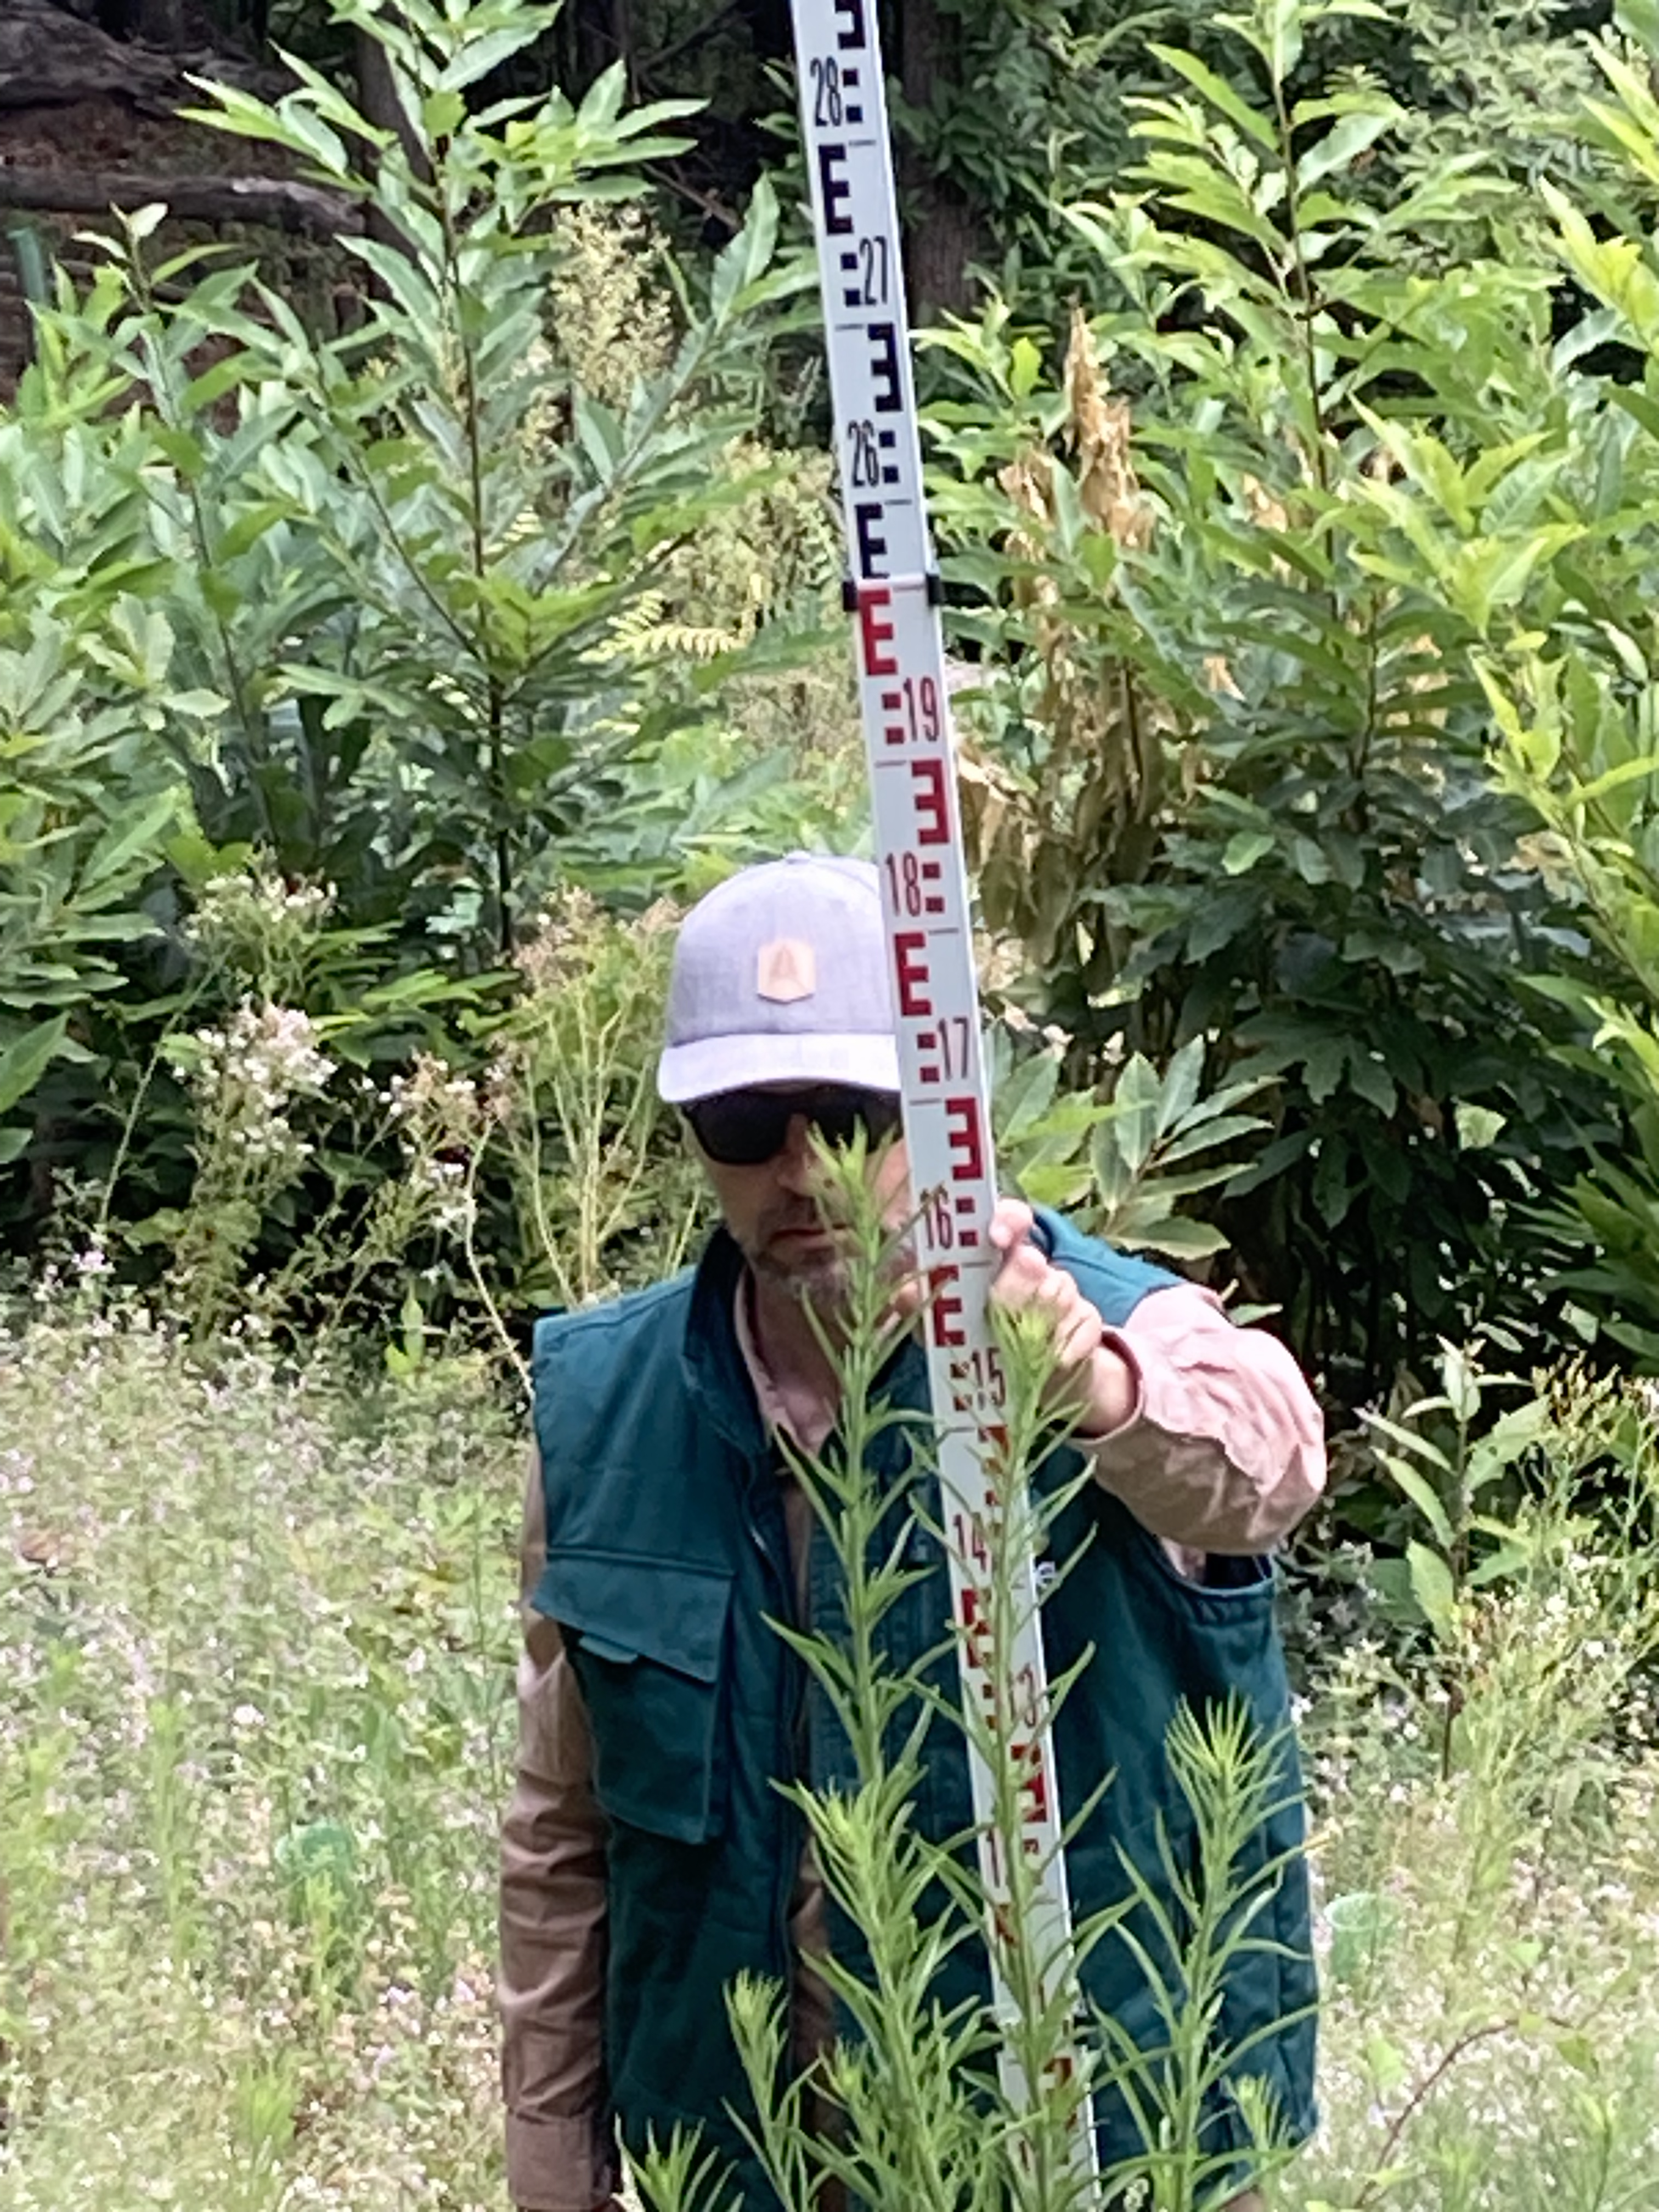


Unbundling credits: Separate into discrete units (Co2 Removal by reforestation, Biodiversity gain by taxocenosis, soil conservation/resotoration m2, water infiltration m3)
Carbon Removal: 180 Credits
Biodiversity: 390 Credits
Soil: 1296 Credits
Water: 2112 Credits
Smart Contract: https://polygonscan.com/token/0x2f34c3b766f8f9b07a179958aabcd74956be407e
https://polygonscan.com/tx/0x1053a325d4d8ca7a9e3defee442071619351c10131fe90404be0f7abd0fb2a01
Monitoring schedule
| Year | Month of activity | Activity to perform for carbon assessment | Activity to perform for biodiversity |
| 2022 | November 1-15 | Satellite survival and growth monitoring | Plant diversity_00: Baseline |
| December | Project Validation | Plant diversity_01 | |
| 2023 | April/May | Field, drone & survival monitoring | Eco-acoustic_01 |
| September/October | Field, drone & satellite survival monitoring | ||
| 2024 | April/May | Field, drone & satellite survival monitoring | Eco-acoustic_02 |
| September/October | Field, drone & satellite survival monitoring | ||
| 2025 | April/May | Field, drone & satellite survival monitoring | Eco-acoustic_03 |
| September/October | Field, drone & satellite survival monitoring | ||
| 2026 | April/May | Field, drone & satellite survival monitoring | Eco-acoustic_04 |
| September/October | Field, drone & satellite survival monitoring | ||
| 2027 | April/May | Field, drone & satellite survival monitoring | Eco-acoustic_05; plant diversity_02 |
| September/October | Field, drone & satellite survival monitoring | ||
| 2028 | April/May | Field, drone & satellite survival and growth monitoring | Eco-acoustic_06 |
Some great things about this project
This project promotes biodiversity, the fight against climate change and protect endangered species


 by
by